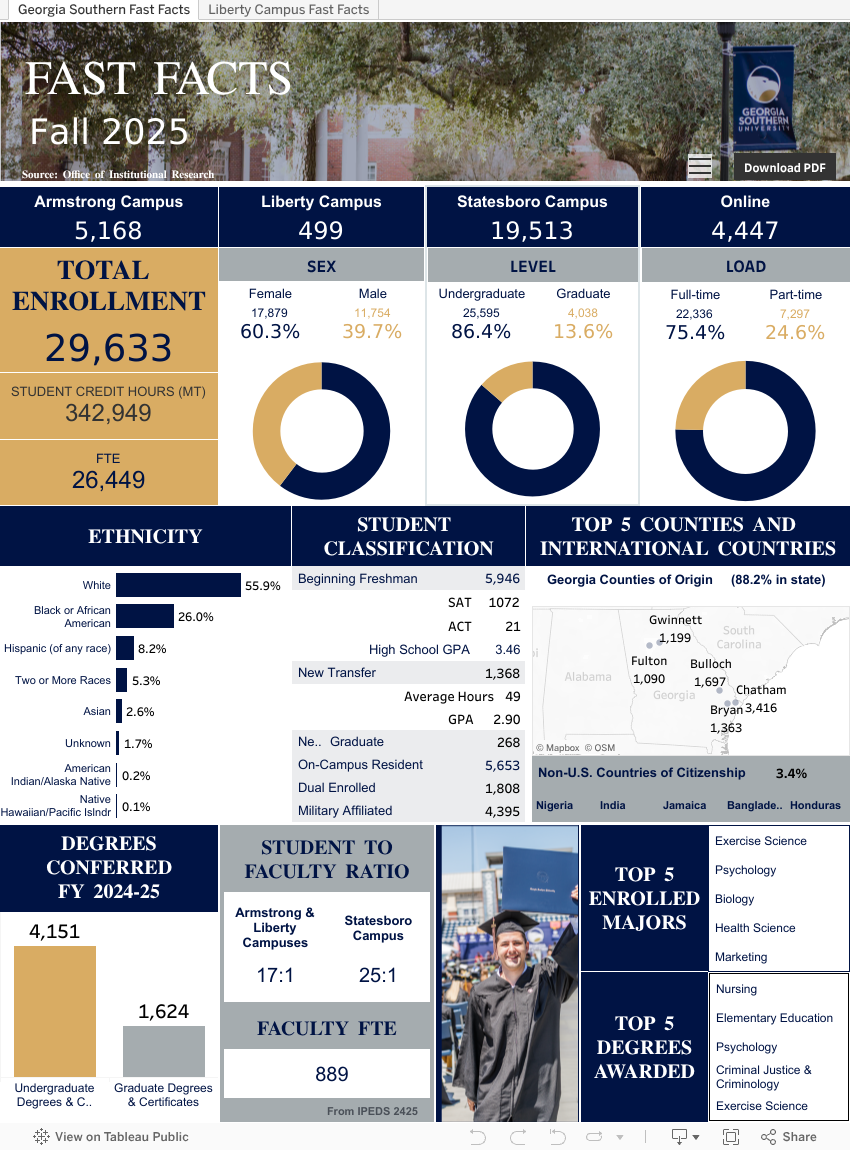
Fast Facts
Student data are presented in the Fast Facts infographic dashboard. The information included is based on the most frequently requested types of data. See the University’s Fact Book and Common Data Set for more history and trend information.
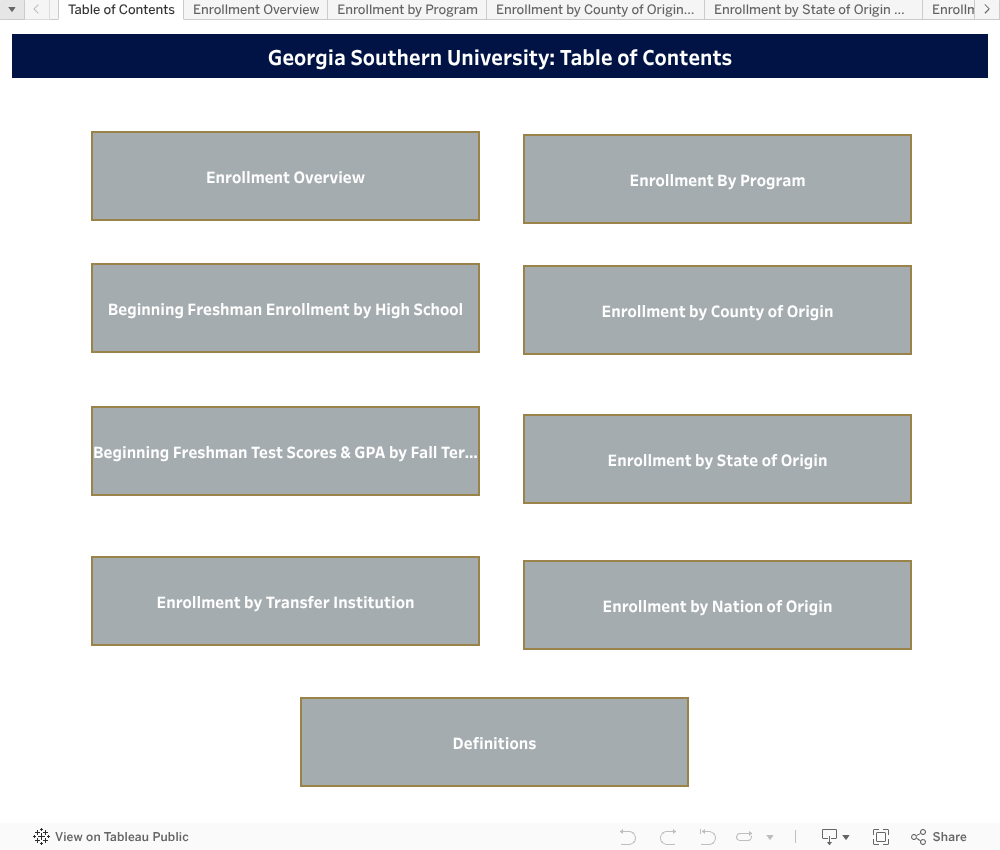
Fact Book / Interactive Dashboards
The Georgia Southern fact book is composed of interactive dashboards based on official census data on our students, faculty, and University’s services.
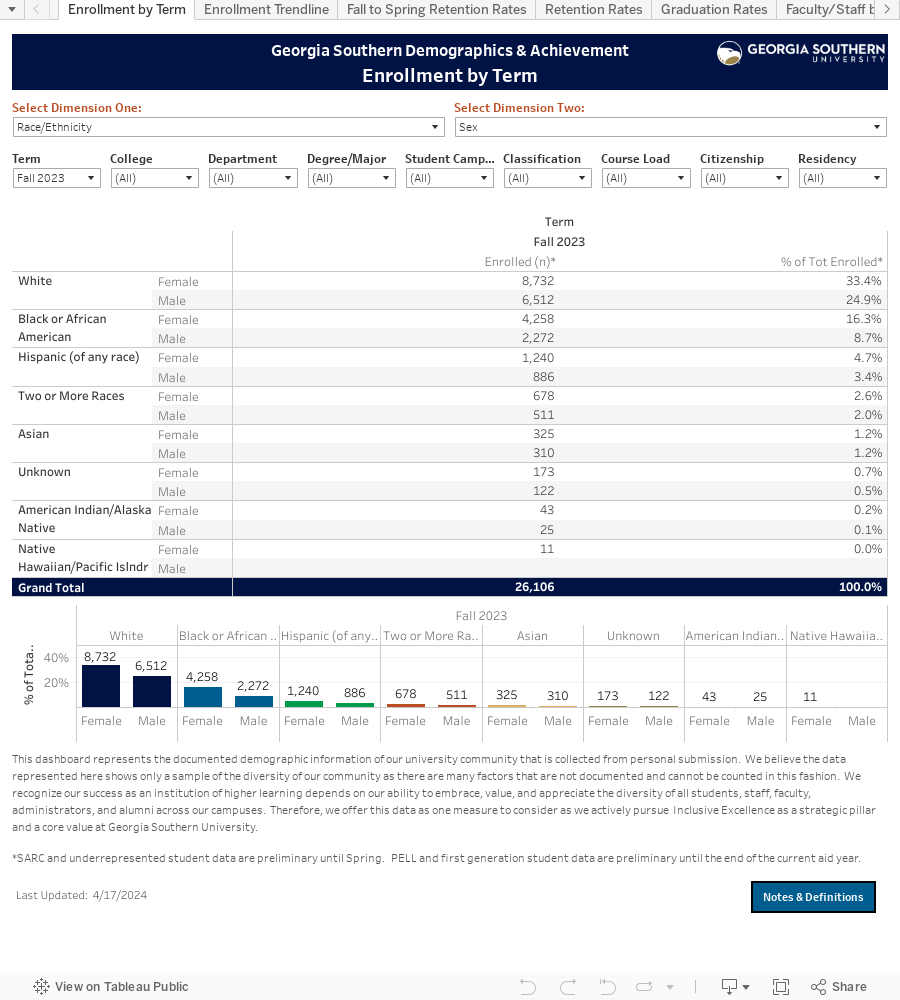
An Interactive Dashboard Reporting Official Mid-Term Census Student Enrollment Data. the Data Included Are Enrollment by Classification, Load Type (full-Time, Part-Time), Race/ethnicity, Sex, Age Range, Campus, College, Degree, Major, Sat and Act Scores, Undergraduate Transfers, Country of Citizenship, State of Residence, Georgia County of Origin, Georgia High Schools of Beginning Freshman, and Fte (full-Time Equivalent). Source: From The Census Enrollment Files
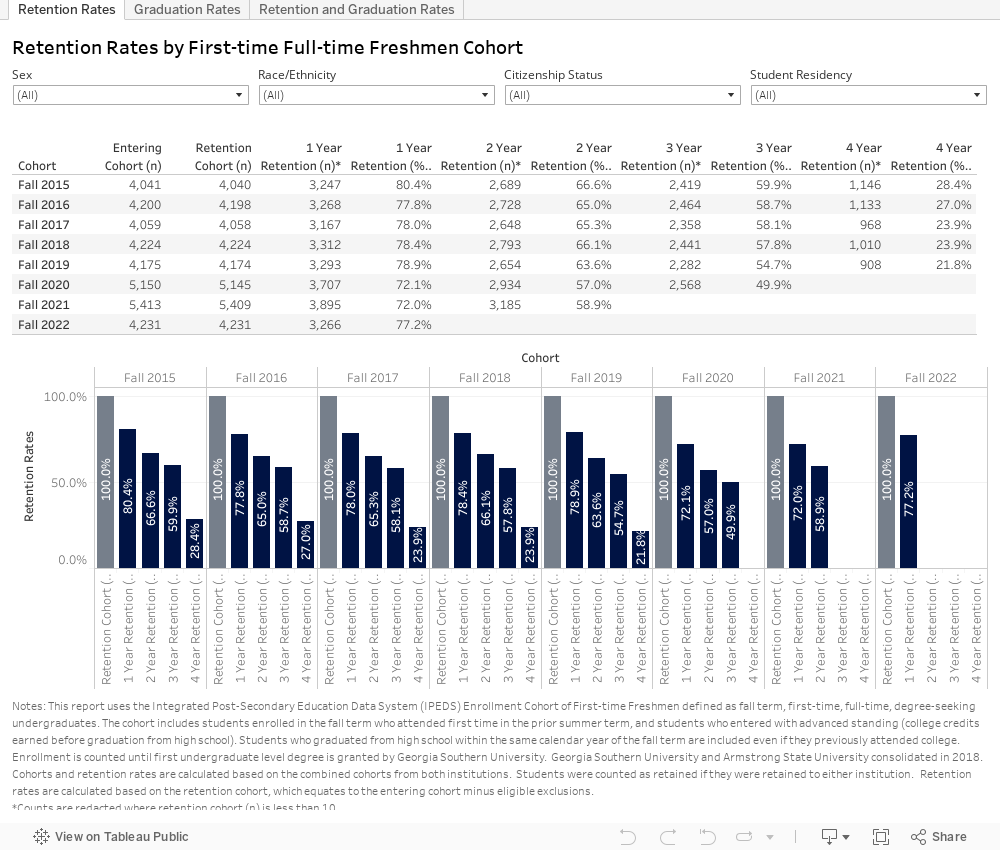
An interactive dashboard reporting retention (1-4 years) and graduation (4-6 year) rates by Integrated Post-Secondary Education Data System (IPEDS) First-time Full-time Freshman Cohort, race/ethnicity, sex, citizenship status, and student residency.
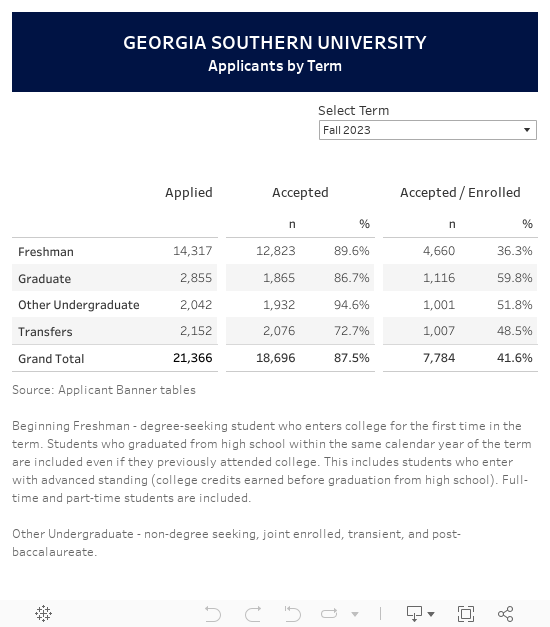
An Interactive Dashboard Reporting Applied, Accepted and Accepted/enrolled Information on Beginning Freshmen, Transfers, Other Undergraduates, and Graduate Level Applicants by Fall Term. Source: From The Banner Application Files
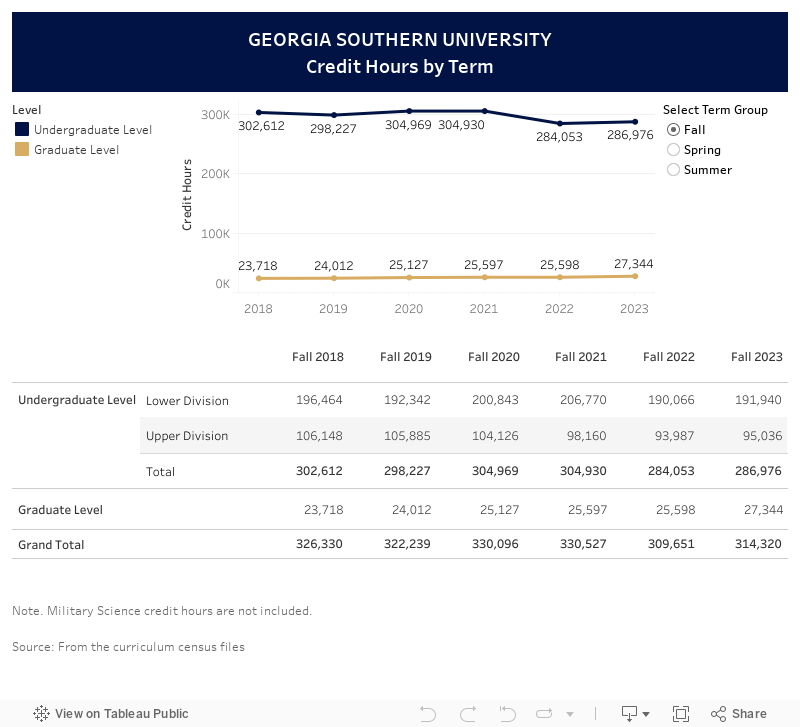
An Interactive Dashboard Reporting Credit Hours by Term and Level. Military Science Credit Hours Are Not Included. Source: From The Curriculum Census Files
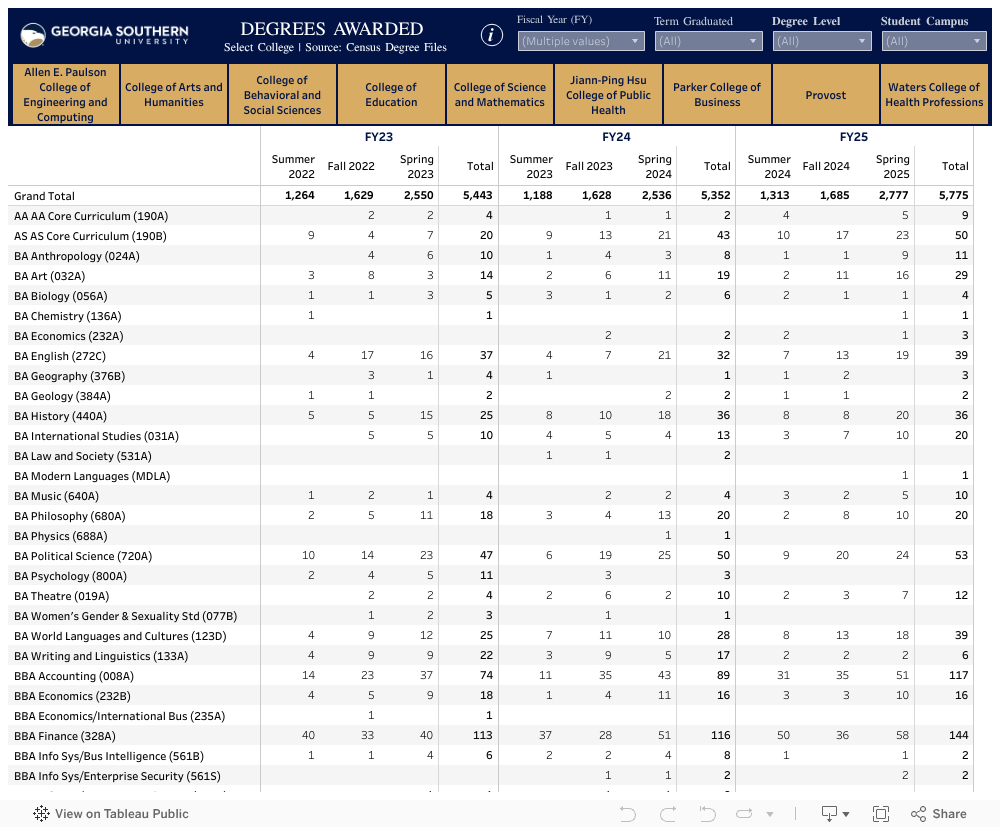
An Interactive Dashboard Reporting Degrees Awarded by Fiscal Year, Degree Level, Student Campus, College, Degree and Major. Source: From The Census Degree Files
Note: Total Counts May Differ to The Usg Reports Due to Different Counting Methods. Usg Counts by Cip Code and Georgia Southern Counts by Majors. Different Majors May Have the Same Cip Code.
This dashboard represents the documented demographic information of our university community that is collected from personal submission. We believe the data represented here shows only a sample of the diversity of our community as there are many factors that are not documented and cannot be counted in this fashion. We recognize our success as an institution of higher learning depends on our ability to embrace, value, and appreciate the diversity of all students, staff, faculty, administrators, and alumni across our campuses. Therefore, we offer this data as one measure to consider as we actively pursue Inclusive Excellence as a strategic pillar and a core value at Georgia Southern University.
An Interactive Dashboard Reporting Students Military Affiliation by Campus and Primary Category. Source: From The Military & Veteran Services Office and Census Enrollment Files

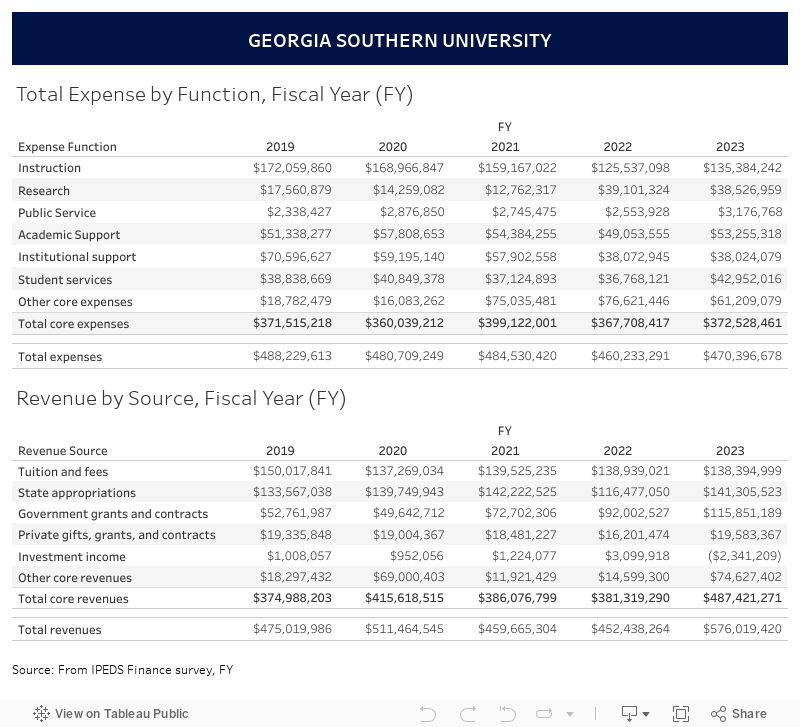
A Dashboard Reporting Total Expenses by Function Fiscal Year, and E&g Revenue by Source and Fiscal Year. Source: From The Ipeds Finance Survey, Fy
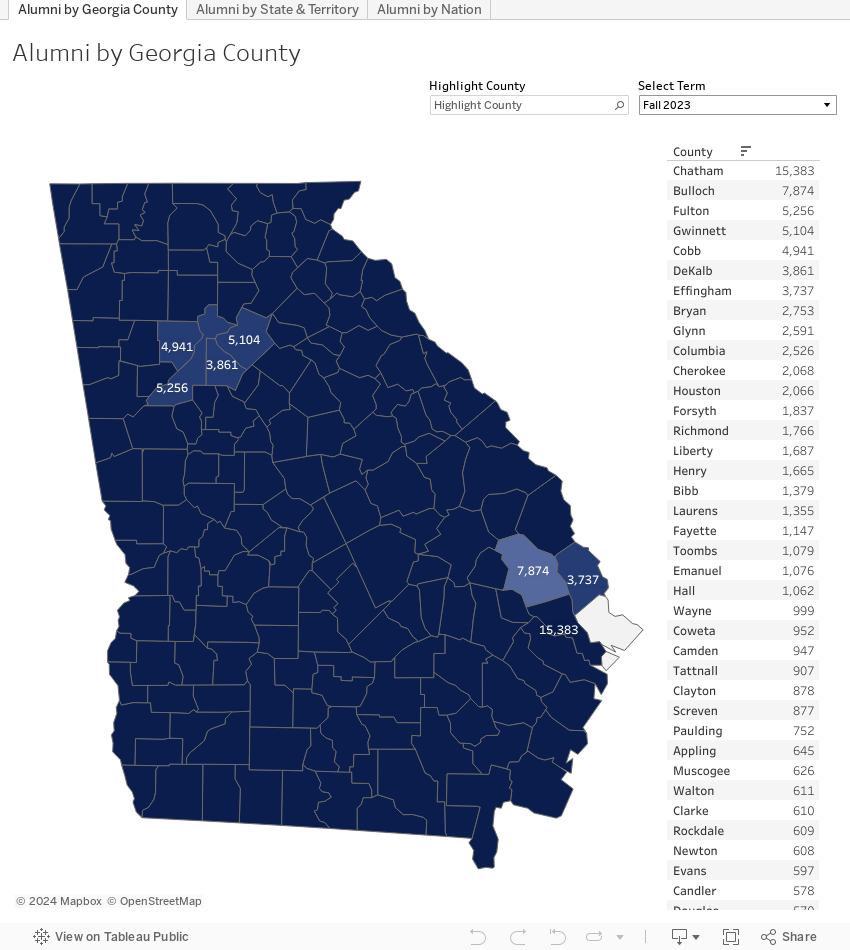
An Interactive Dashboard Reporting Alumni by Georgia County, State and Territory, and Nation. Source: From The Office of Alumni Relations
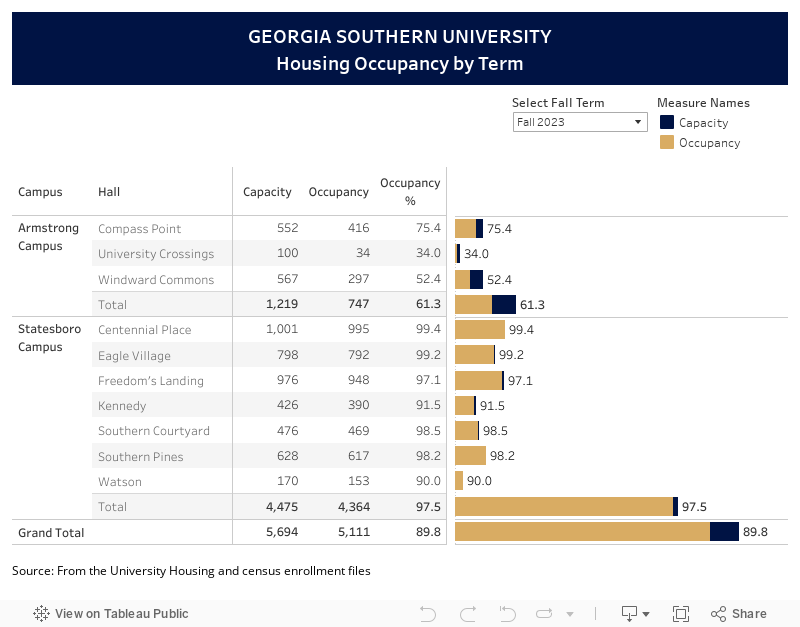
An Interactive Dashboard Reporting On-Campus Housing by Campus, Residence Hall, Capacity and Occupancy. Source: From The University Housing and Census Enrollment Files
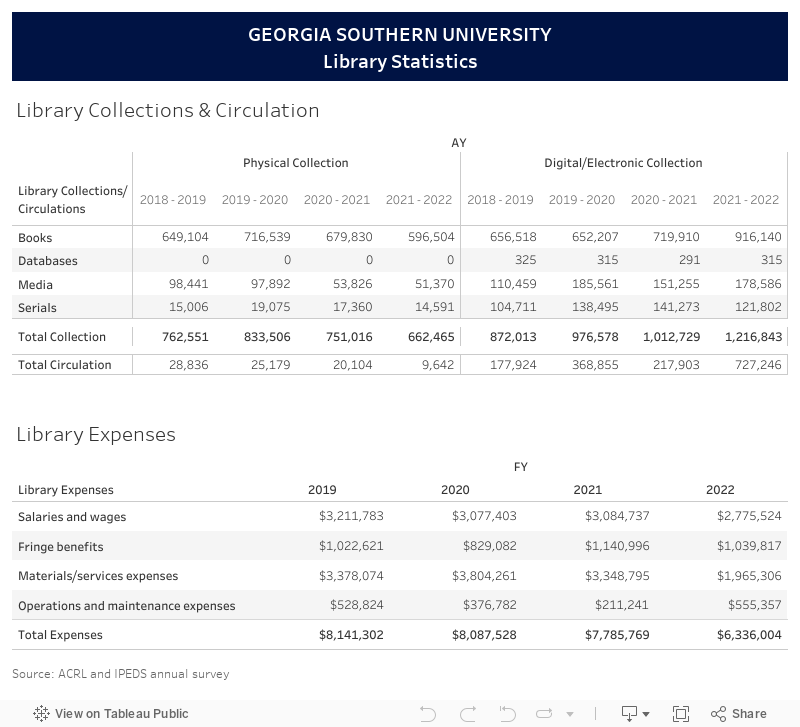
An Interactive Dashboard Reporting Library Collections/circulation by Academic Year, Physical Collection and Digital/electronic Collection, and Library Expenses by $ Amount and Fiscal Year. Source: From The Acrl and Ipeds Annual Survey