Goals & FY26 Results

Tree-lined street leading to a manicured circular hedge and a white gazebo beyond, framed by lush green trees and lampposts with banners on either side.

Every Goal. Every Action. Every Measure.

Explore Georgia Southern’s progress in the first year of Soaring Beyond 2030. Results are organized by People, Purpose and Action, with baseline and fiscal year 2026 data for each key performance indicator.

Goals 1–3Goals 4–7 Goals 8–10

How We Measure Progress

A plan built to be measured.

Performance Excellence connects the strategic plan to daily work. Each goal has defined key performance indicators. Leadership scorecards, quarterly tasks and employee engagement action plans help teams track their work, while feedback from the University community informs ongoing improvement.

Results are reported by the offices responsible for the work and shared annually.

Our People

Supporting the people who learn, work, lead and serve across Georgia Southern.

Action 1 — Strengthen accountability and performance tracking

  • 1.1.1 Employee Engagement Action Plans submitted — 94.10% (baseline 100%)
  • 1.1.2 Quarterly tasks completed by division — 94% (baseline 88%)
  • 1.1.3 Strategic action items updated quarterly in the Progress Tracker by Athletics leadership — 9 (baseline 9)

Action 2 — Improve internal communication

  • 1.2.1 Employee Engagement Survey communications score — 3.58 (baseline 3.42)
  • 1.2.2a Strategic internal messaging click rate — 9.90% (baseline 15.86%)
  • 1.2.2b Strategic internal messaging open rate — 76.05% (baseline 87.90%)

Action 3 — Improve external communication

  • 1.3.1 Positive perception in the university’s public sentiment score — 53% (baseline 43%)

Action 1 — Promote student well-being

  • 2.1.1a Student Satisfaction Inventory Q1, sense of belonging, satisfaction score — 5.58 (baseline 5.58)
  • 2.1.1b Student Satisfaction Inventory Q1, sense of belonging, gap — 0.64 (baseline 0.64)
  • 2.1.2a Student Satisfaction Inventory Q7, campus safety and security, satisfaction score — 5.82 (baseline 5.74)
  • 2.1.2b Student Satisfaction Inventory Q7, campus safety and security, gap — 0.72 (baseline 0.76)
  • 2.1.3a Student Satisfaction Inventory Q59, concern for students as individuals, satisfaction score — 5.65 (baseline 5.6)
  • 2.1.3b Student Satisfaction Inventory Q59, concern for students as individuals, gap — 0.75 (baseline 0.77)
  • 2.1.4a Student Satisfaction Inventory Q67, freedom of expression, satisfaction score — 6.02 (baseline 6)
  • 2.1.4b Student Satisfaction Inventory Q67, freedom of expression, gap — 0.5 (baseline 0.44)
  • 2.1.5 Counseling Center student symptom improvement compared with a nationwide sample — 97.8% (baseline 97.20%)
  • 2.1.6 Wellness Curriculum participants reporting positive intent to adopt healthy behaviors — 74% (baseline 77%)

Action 2 — Promote faculty and staff well-being

  • 2.2.1 Employee retention rate — 86.99% (baseline 87.82%)
  • 2.2.2 Participation in USG and Georgia Southern employee wellness events — 3.35% (baseline 15.90%)

Action 3 — Increase engagement on all campuses

  • 2.3.1 Employee Engagement Survey total score — 4.01 (baseline 3.87)
  • 2.3.2 Unique and total students in Eagle Engage — 21,972 (baseline 22,294)
  • 2.3.3 Students engaged in 10 or more Eagle Engage events — 7,582 (baseline 6,854)
  • 2.3.4a First-year attendees at games and events across campuses — 2,889 (baseline 12,072)
  • 2.3.4b Sophomore attendees at games and events across campuses — 4,524 (baseline 3,076)
  • 2.3.4c Junior attendees at games and events across campuses — 2,208 (baseline 5,137)
  • 2.3.4d Senior attendees at games and events across campuses — 3,775 (baseline 1,068)
  • 2.3.4e Graduate attendees at games and events across campuses — 591 (baseline 109)
  • 2.3.4f East Georgia attendees at games and events — 16 (baseline 1,364)
  • 2.3.4g Medical College of Georgia attendees at games and events — 0 (baseline 5)

Action 1 — Strengthen orientation

  • 3.1.1 Total student participation in Eagle Experience — 218,133 (baseline 206,094)
  • 3.1.2 Employee satisfaction with extended orientation — Reported Net Promoter Score of 8 out of 10, with limited data (new metric)

Action 2 — Expand professional development

  • 3.2.1 Professional development experiences tracked by the Office of Institutional Engagement — 21,350 (new metric)
  • 3.2.2 Student professional development events and activities tracked in Eagle Engage — 705 (baseline 705)
  • 3.2.3 Student-athletes and Athletics staff participating in professional development — 660 (baseline 585)

Action 3 — Expand leadership development

  • 3.3.1 Students in leadership programs sponsored by the Office of Leadership and Community Engagement — 359 (baseline 310)
  • 3.3.2 Employees engaged in leadership development tracked by the Office of Organizational Effectiveness — 648 (baseline 329)
  • 3.3.3 Student-athletes and Athletics staff participating in leadership development — 923 (baseline 842)

Action 4 — Promote mentorship

  • 3.4.1 Mentee–mentor connections in Georgia Southern mentor programs — 69 (baseline 39)

Our Purpose

Creating opportunities through student success, discovery, teaching and community engagement.

Action 1 — Implement Ready Day 1 Connect

  • 4.1.1 Median earnings one year after graduation — $53,562 (baseline $50,903)
  • 4.1.2 Career readiness engagement — 78.30% (baseline 76%)
  • 4.1.3a Recognition of career competencies — 27% (baseline 20%)
  • 4.1.3b Recognition of career competencies — 92% (baseline 85%)
  • 4.1.4 Articulation of career competencies — 3.35 (baseline 3.26)

Action 2 — Strengthen pathways to student success

  • 4.2.1 Total scholarships awarded — $6,668,532 (baseline $6,063,526)
  • 4.2.2 Total fall enrollment — 31,599 (baseline 29,332)
  • 4.2.3 IPEDS retention rate — 81.60% (FY24 baseline 77.80%)
  • 4.2.4 Total degrees conferred — 5,771 (FY24 baseline 5,353)
  • 4.2.5 Four-year graduation rate — 32.30% (baseline 30.80%)
  • 4.2.6 Six-year graduation rate — 53.80% (baseline 55%)

Action 1 — Advance research infrastructure and support

  • 5.1.1 Value of grant proposals submitted — $106.51 million (baseline $136.5 million)
  • 5.1.2 Value of grants awarded — $12.42 million (baseline $26.7 million)
  • 5.1.3 Total research expenditures — $57.8 million (baseline $49.26 million)

Action 2 — Grow and support graduate programs

  • 5.2.1 Graduate students enrolled — 4,038 (baseline 3,888)
  • 5.2.2 Research graduate students funded — 172 (baseline 92)
  • 5.2.3 Funding for research graduate students — $1,893,766.95 (baseline $650,364.21)
  • 5.2.4 Research doctorates conferred — 84 (baseline 78)

Action 3 — Strengthen faculty research support

  • 5.3.1 Scholarly output — 812 (CY2024 baseline 766)
  • 5.3.2 Field-Weighted Citation Impact — 1.13 (CY2024 baseline 1.06)
  • 5.3.3 Times Higher Education University Rankings — 1501+ (CY2025 baseline 1501+)
  • 5.3.4 International engagement — 32% (CY2024 baseline 31.60%)
  • 5.3.5a Intellectual property disclosures and awarded patents — 16 (baseline 6)
  • 5.3.5b Intellectual property disclosures and awarded patents — 16 (baseline 0)

Action 1 — Expand practices that support teaching excellence

  • 6.1.1 Participation in Faculty Center programming — 3,582 (baseline 1,827)
  • 6.1.2 Faculty with terminal degrees — 82.40% (baseline 82.70%)
  • 6.1.3 Full-time faculty — 89% (baseline 89%)

Action 2 — Promote high-quality instruction and experiential learning

  • 6.2.1 Experiential learning participation — 6,236 (baseline 3,657)
  • 6.2.2a Student Satisfaction Inventory Q41, commitment to academic excellence — 5.9 (baseline 5.85)
  • 6.2.2b Student Satisfaction Inventory Q41, commitment to academic excellence — 0.55 (baseline 0.56)
  • 6.2.3a Student Satisfaction Inventory Q58, quality of instruction — 5.73 (baseline 5.68)
  • 6.2.3b Student Satisfaction Inventory Q58, quality of instruction — 0.81 (baseline 0.81)

Action 1 — Expand community partnerships

  • 7.1.1 New or strengthened partnerships aligned with community and business engagement and economic development goals — 61 (new metric)
  • 7.1.2 Annual community service hours completed by student-athletes and Athletics staff — 7,300 (baseline 6,200)
  • 7.1.3 Service-learning credit hours — 72 (baseline 48)

Action 2 — Support economic growth and regional prosperity

  • 7.2.1 Businesses supported by economic engagement efforts — 393 (baseline 571)
  • 7.2.2 Annual economic impact on Georgia — $1,239,916,219 (FY24 baseline $1.167 billion)

Our Action

Aligning university strengths with emerging needs and improving how we deliver results.

Action 1 — Coordinate student success efforts

  • 8.1.1a Term-to-term retention rates — 82% (baseline 78%)
  • 8.1.1b Term-to-term retention rates — 66% (baseline 65%)
  • 8.1.1c Term-to-term retention rates — 58% (baseline 51%)
  • 8.1.1d Term-to-term retention rates — 21% (baseline 21%)
  • 8.1.2 Fall-to-fall cohort retention rate — 81.60% (FY24 baseline 77.80%)
  • 8.1.3 Cohort graduation rate — 53.80% (baseline 55%)
  • 8.1.4a Progression rate — 59.40% (baseline 59.30%)
  • 8.1.4b Progression rate — 60.80% (baseline 55.10%)

Action 2 — Develop, market and support GS Online

  • 8.2.1 Total headcount in fully online programs — 4,453 (baseline 3,834)
  • 8.2.2 Credits earned in fully online programs — 133,755 (baseline 123,922)
  • 8.2.3 Adult student headcount online — 764 (baseline 588)
  • 8.2.4 Application volume for adult students — 2,072 (baseline 519)
  • 8.2.5 Online cohort retention rate — 47.80% (FY24 baseline 61.80%)
  • 8.2.6 Online cohort graduation rate — 12.50% (baseline 23.80%)

Action 3 — Strengthen pathways from undergraduate to graduate programs

  • 8.3.1 Undergraduates enrolling in accelerated bachelor’s-to-master’s programs — 15 (FY24 baseline 12)
  • 8.3.2 Georgia Southern undergraduates enrolled in a Georgia Southern graduate program — 275 (FY24 baseline 287)

Action 4 — Expand metro Atlanta recruitment and engagement

  • 8.4.1 Enrollment of students from metro Atlanta ZIP codes — 303 (baseline 275)
  • 8.4.2 Enrollment yield from metro Atlanta ZIP codes — 59.30% (baseline 63.50%)
  • 8.4.3 Applications from metro Atlanta ZIP codes — 846 (baseline 671)

Action 5 — Improve enrollment efforts at open-access campuses

  • 8.5.1 Student headcount at open-access campuses — 499 (baseline 444)
  • 8.5.2 Military-connected student headcount — 4,395 (baseline 3,986)
  • 8.5.3 Credits completed by military-connected students — 51,741 (baseline 47,199)
  • 8.5.4 Retention rate for students who start at access campuses — 57.80% (FY24 baseline 62.30%)

Action 1 — Amplify the public impact of research

  • 9.1.1 Quartile 1 and 2 peer-reviewed publications — 78.80% (CY2024 baseline 79.50%)
  • 9.1.2 Field-Weighted Citation Impact — 1.13 (CY2024 baseline 1.06)
  • 9.1.3a Faculty publications in top-tier journals — 1.80% (CY2024 baseline 2.80%)
  • 9.1.3b Faculty publications in top-tier journals — 24.80% (CY2024 baseline 28.50%)

Action 2 — Advance philanthropic engagement

  • 9.2.1 Percentage of unique alumni engagement — 6,934 (new metric)
  • 9.2.2 Total annual gifts and pledges — $27,395,755 (baseline $27,055,895)
  • 9.2.3 Annual alumni, donor and fan engagement visits — 605 (baseline 545)
  • 9.2.4 Annual funds raised by the Georgia Southern Athletics Foundation — $12,115,384 (baseline $10,985,000)

Action 1 — Automate and clarify transfer admissions

  • 10.1.1 Transfer yield rate, from admission to enrollment — 57.10% (baseline 49.50%)
  • 10.1.2 Total transfer applications — 3,256 (baseline 2,693)
  • 10.1.3 Response time for transcript evaluation requests — 9.26 (baseline 13.07)

Action 2 — Streamline commitment and onboarding for incoming students

  • 10.2.1 Yield rate, from admission to enrollment — 35.60% (baseline 31.20%)
  • 10.2.2 Melt rate, from registration to enrollment at census — 10.50% (baseline 9.50%)
  • 10.2.3 First-term persistence rate — 93.5% (FY24 baseline 93.7%)

Action 3 — Align budgets with priorities and improve processes

  • 10.3.1 Core expenditures per full-time equivalent — $12,676 (baseline $13,658)
  • 10.3.2 Hours saved per month through AI, robotic process automation and other automation — 4,568 (baseline 3,273)

Action 4 — Expand leadership scorecards

  • 10.4.1 Average university leadership scorecard score — 3.7 (baseline 3.8)
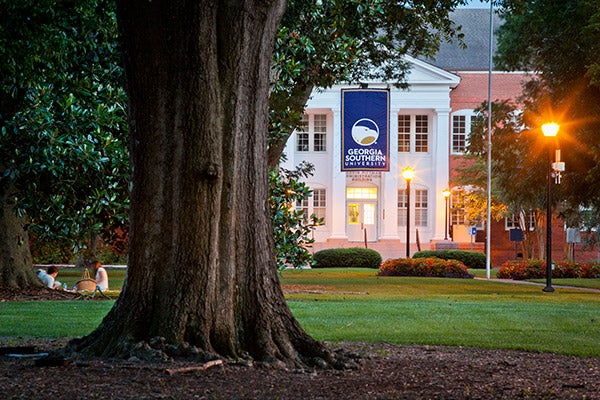
A large tree stands in the foreground on a grassy lawn, with students sitting nearby. In the background, a building with a Georgia Southern University banner is lit by street lamps at dusk.

Explore the Stories Behind the Results

See how the work of students, faculty, staff and partners connects these measures to opportunities across Georgia Southern and our communities.